
A1C Conversion: What Your Number Means and How to Lower It
Learn a1c conversion to glucose levels, what your A1C number means, how to lower it, and use our interactive calculator for better diabetes management.


On this page
Your A1C Explained: What Your Number Means and How to Lower It
The A1C test is one of the most important tools in diabetes management, yet many people walk out of the lab or their doctor's office with a number they don't fully understand. Unlike a single blood-glucose reading that captures one moment in time, A1C reflects your average blood glucose over the past two to three months. That makes it a powerful snapshot of how well your management plan is working — and where you might need to adjust.
When our team delves into the intricacies of A1C levels, we prioritize translating complex medical guidelines into plain language that anyone can understand. Our editors meticulously review the ADA's Standards of Care and other authoritative sources to ensure that the information we provide is accurate and helpful.
Understanding what your A1C number means is the first step toward taking control of your diabetes management. Research shows that A1C values between 6.0% and 6.5% are associated with a 25 to 50% incidence of developing diabetes over five years, while lower values in the 5.5% to 6.0% range carry less than a 25% risk. These statistics underscore why knowing your number — and what it predicts — matters for long-term health.
For many people, the A1C result becomes a quarterly check-in: a way to see whether the daily work of managing glucose is paying off. If your number is higher than you'd like, it's not a judgment — it's data. And data can guide the next conversation with your care team about medication adjustments, meal planning, or activity goals. If you're looking to understand how your A1C translates into daily glucose levels, tools like an A1C calculator can help you see the connection between the percentage and the numbers you see on your meter or continuous glucose monitor.
This guide will walk you through what A1C is, how to interpret your result, what steps can help bring it down, and how to use conversion tools to make sense of your data. Every section is designed to give you the context you need to ask better questions and make informed decisions with your healthcare provider.
Learn what your A1C number means, how to lower it, and use our interactive A1C calculator for better diabetes management.
What is A1C?
The A1C test—also called HbA1c or glycated hemoglobin—measures the percentage of your red blood cells that have glucose attached to them. Because red blood cells live for about three months, the A1C test reflects your average blood glucose over the past two to three months. It's one of the most important tools for managing diabetes and assessing how well your treatment plan is working.
Unlike a fingerstick glucose test that captures a single moment in time, A1C gives you and your care team a broader view of your glucose control. This makes it a key marker for adjusting medications, setting treatment goals, and evaluating your risk for diabetes-related complications.
How A1C is Measured
The A1C test is a simple blood draw, usually done at a lab or during a clinic visit. Some providers use a point-of-care device that delivers results in minutes. The test measures the proportion of hemoglobin—the oxygen-carrying protein in red blood cells—that has bonded with glucose. When glucose circulates in your bloodstream, it attaches to hemoglobin through a process called glycation. The higher your average glucose, the more glycation occurs, and the higher your A1C percentage.
Because the test reflects a multi-month average, it's less affected by day-to-day fluctuations than a single glucose reading. However, certain conditions can influence A1C accuracy. Factors such as anemia, chronic kidney disease, recent blood transfusions, or hemoglobin variants may cause the test to read higher or lower than your true glucose exposure. If you have any of these conditions, discuss alternative monitoring strategies with your care team.
Why A1C Matters in Diabetes Management
A1C is the standard for setting treatment targets and evaluating long-term glucose control. The American Diabetes Association (ADA) Standards of Care recommend individualized A1C goals based on factors like age, duration of diabetes, presence of complications, and risk of hypoglycemia. For many adults with diabetes, an A1C below 7% is a common target, but your goal may be higher or lower depending on your specific situation.
Tracking A1C over time helps you and your provider see whether your current plan—medication, diet, physical activity—is moving you toward your target. A rising A1C may signal the need for treatment intensification, while a stable or declining A1C suggests your plan is working. Because A1C correlates with the risk of microvascular complications like retinopathy, neuropathy, and nephropathy, keeping it within your target range is a central part of reducing long-term risk.
For those newly diagnosed or adjusting to a new medication, understanding average blood sugar by A1C conversion can help translate the percentage into the daily glucose numbers you see on your meter or continuous glucose monitor (CGM).
Continuous glucose monitoring systems are proven to lower glycated hemoglobin levels and decrease the time spent in hypoglycemia or hyperglycemia, improving quality of life for people with type 1 and type 2 diabetes.
Understanding Your A1C Number
Your A1C result is reported as a percentage, and that percentage reflects the proportion of your hemoglobin that has glucose attached to it. The higher the percentage, the higher your average blood glucose has been over the past two to three months. Understanding where your number falls—and what it signals about your diabetes risk or current management—helps you and your care team decide on next steps.
What the Ranges Mean
The American Diabetes Association and other clinical guidelines use A1C thresholds to classify diabetes risk and diagnosis. These ranges are not rigid dividing lines—individual context matters—but they provide a shared language for you and your provider.
- Below 5.7%: Generally considered normal. Most people without diabetes fall into this range.
- 5.7% to 6.4%: Prediabetes range. Your risk of developing type 2 diabetes is elevated, and lifestyle or medication interventions may be discussed.
- 6.5% or higher: Meets the diagnostic threshold for diabetes when confirmed by repeat testing or additional criteria.
Within the prediabetes range, risk is not uniform. Research shows that lower HbA1c values in the range of 5.5% to 6.0% are associated with less than 25% risk of developing diabetes over five years, while HbA1c values between 6.0% and 6.5% carry a 25% to 50% incidence of progression to diabetes in the same period. These statistics underscore why early intervention—before you reach the higher end of prediabetes—can make a meaningful difference.
Why Your Number Matters
An A1C result is not just a label—it's a signal about your body's glucose regulation and your future risk. For someone newly diagnosed with prediabetes, an A1C of 5.8% is an opportunity to slow or prevent progression through diet, activity, and possibly medication. For someone with established diabetes, an A1C above your individualized target may prompt a medication adjustment or a closer look at daily glucose patterns.
The A1C test has limitations. It reflects an average, so it can miss significant glucose swings—someone with frequent lows and highs might have the same A1C as someone with stable, moderate glucose. Certain conditions—anemia, kidney disease, some hemoglobin variants—can make A1C results less accurate. If your A1C doesn't align with your daily glucose readings or your symptoms, bring that discrepancy to your provider. They may order additional tests or rely more heavily on continuous glucose monitoring data.
HbA1c values between 6.0% and 6.5% are associated with a 25% to 50% incidence of developing diabetes over five years—a window where intervention can shift the trajectory.
Confirming Your Target with Your Care Team
There is no single "correct" A1C goal for everyone with diabetes. The ADA Standards of Care recommend an A1C below 7% for many adults with diabetes, but your personal target may be higher or lower depending on your age, how long you've had diabetes, other health conditions, risk of hypoglycemia, and your own preferences. Older adults or those with a history of severe low blood sugars may have a more relaxed target, while younger people with recent-onset diabetes may aim lower to reduce long-term complications.
Never assume your A1C goal from a chart or a calculator. Confirm your individualized target with your care team, and revisit it periodically—your goal may shift as your circumstances change. For more context on how A1C translates to daily glucose levels, see our guide on average blood sugar by A1C conversion.
How to Lower Your A1C
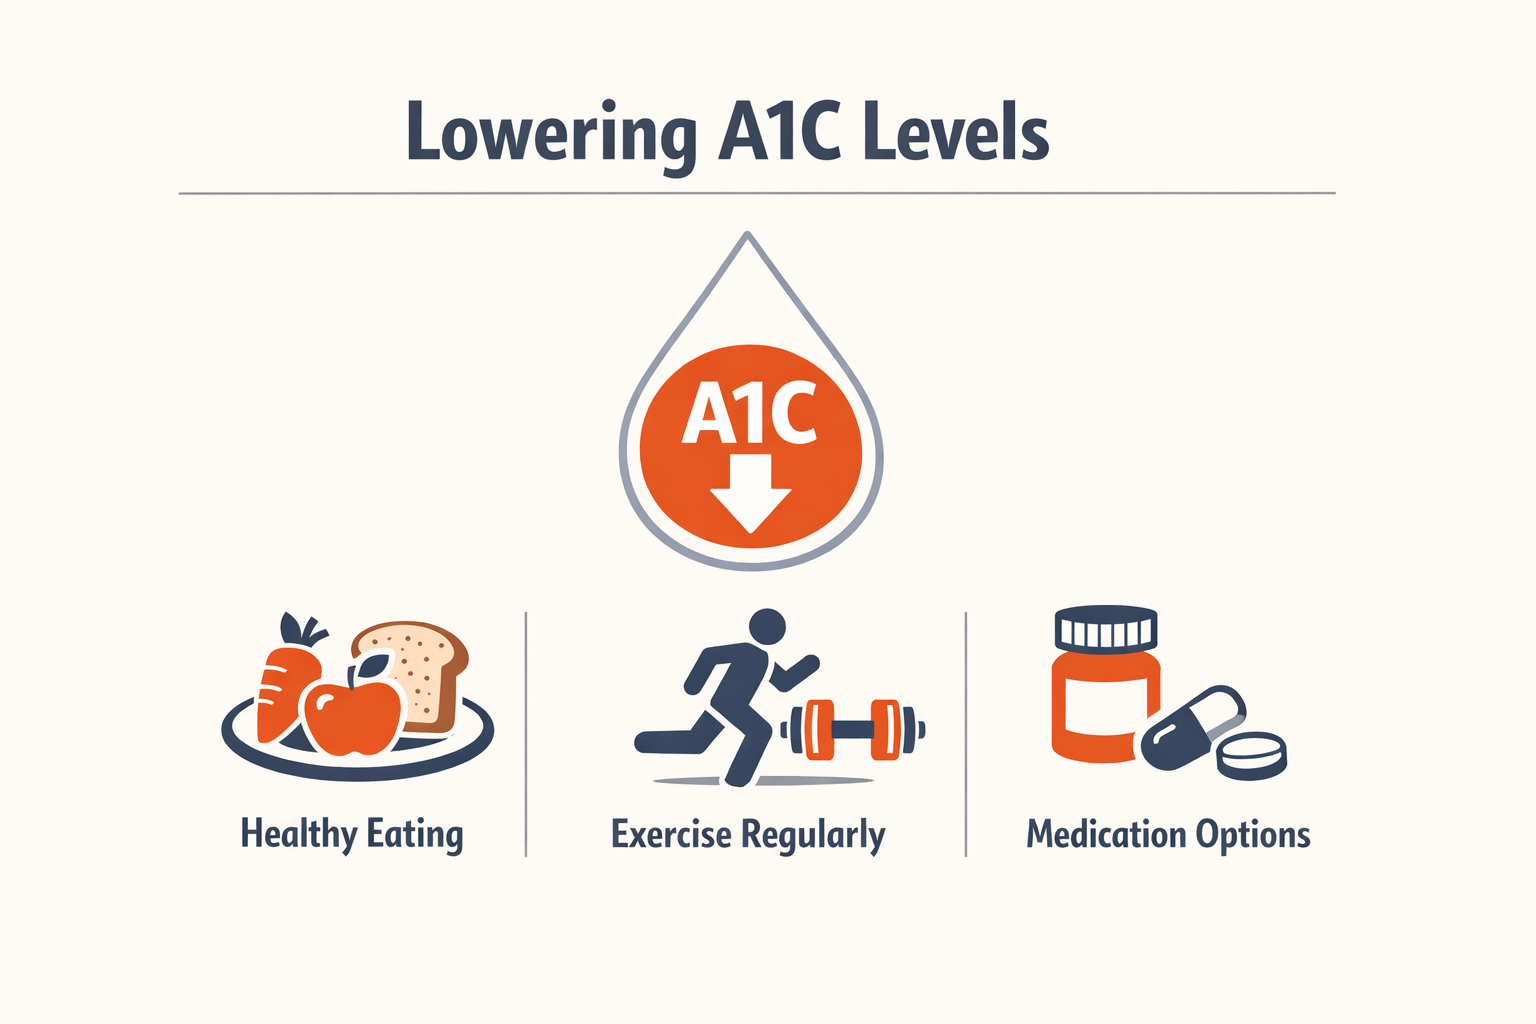
Lowering your A1C is a gradual process that involves consistent changes to diet, activity, and — when prescribed by your care team — medication. No single intervention works for everyone, and the timeline varies widely. What matters is building a sustainable routine that fits your life and your body's response to treatment.
Dietary Changes That Support A1C Reduction
Carbohydrate timing and portion control are the foundation of A1C management. Spreading carbohydrate intake across meals rather than concentrating it at one sitting helps prevent large glucose spikes. Pairing carbohydrates with protein, fat, or fiber slows digestion and smooths the glucose curve.
Replacing refined grains with whole grains, choosing non-starchy vegetables, and limiting sugary beverages are changes that show measurable results over weeks to months. These adjustments reduce both fasting blood glucose and postprandial (after-meal) glucose — the two components that drive A1C down. If you're navigating sweetener choices, stevia vs aspartame: which is safer offers a comparison of two common options.
Physical Activity and Glucose Control
Exercise lowers blood glucose in two ways: it increases insulin sensitivity (making your cells more responsive to insulin) and it allows muscles to take up glucose without needing as much insulin. Both aerobic activity (walking, cycling, swimming) and resistance training (weights, resistance bands) contribute to A1C reduction.
The ADA Standards of Care recommend at least 150 minutes of moderate-intensity aerobic activity per week, spread across at least three days, with no more than two consecutive days without activity. Resistance training on two or more days per week adds further benefit. Even short bouts — a 10-minute walk after meals — can blunt postprandial glucose spikes.
Consistency matters more than intensity. A daily 20-minute walk is more effective for A1C reduction than an occasional high-intensity session followed by days of inactivity.
Medication Options When Lifestyle Changes Aren't Enough
When diet and exercise alone do not bring A1C to target, your care team may prescribe medication. Metformin is typically the first-line oral medication for type 2 diabetes; it reduces glucose production in the liver and improves insulin sensitivity. GLP-1 receptor agonists and SGLT2 inhibitors are also commonly prescribed and have been shown to lower A1C while offering cardiovascular and kidney benefits.
Insulin therapy may be introduced when other medications are insufficient or when A1C is significantly elevated at diagnosis. The goal is to bring glucose levels into a range where the body's own systems can function more effectively.
Realistic Expectations for A1C Reduction
A1C reflects average glucose over approximately three months, so changes take time to register. In clinical studies, patients following structured interventions achieved an average A1C reduction of around 2 percentage points over 12 weeks, with some individuals reaching target levels below 6.5%. However, baseline A1C, adherence to the plan, and individual metabolic response all influence outcomes.
Set incremental goals with your care team rather than aiming for a dramatic drop all at once. A reduction of 0.5% to 1% over three months is meaningful progress and reduces the risk of diabetes-related complications over time.
Using the A1C Calculator
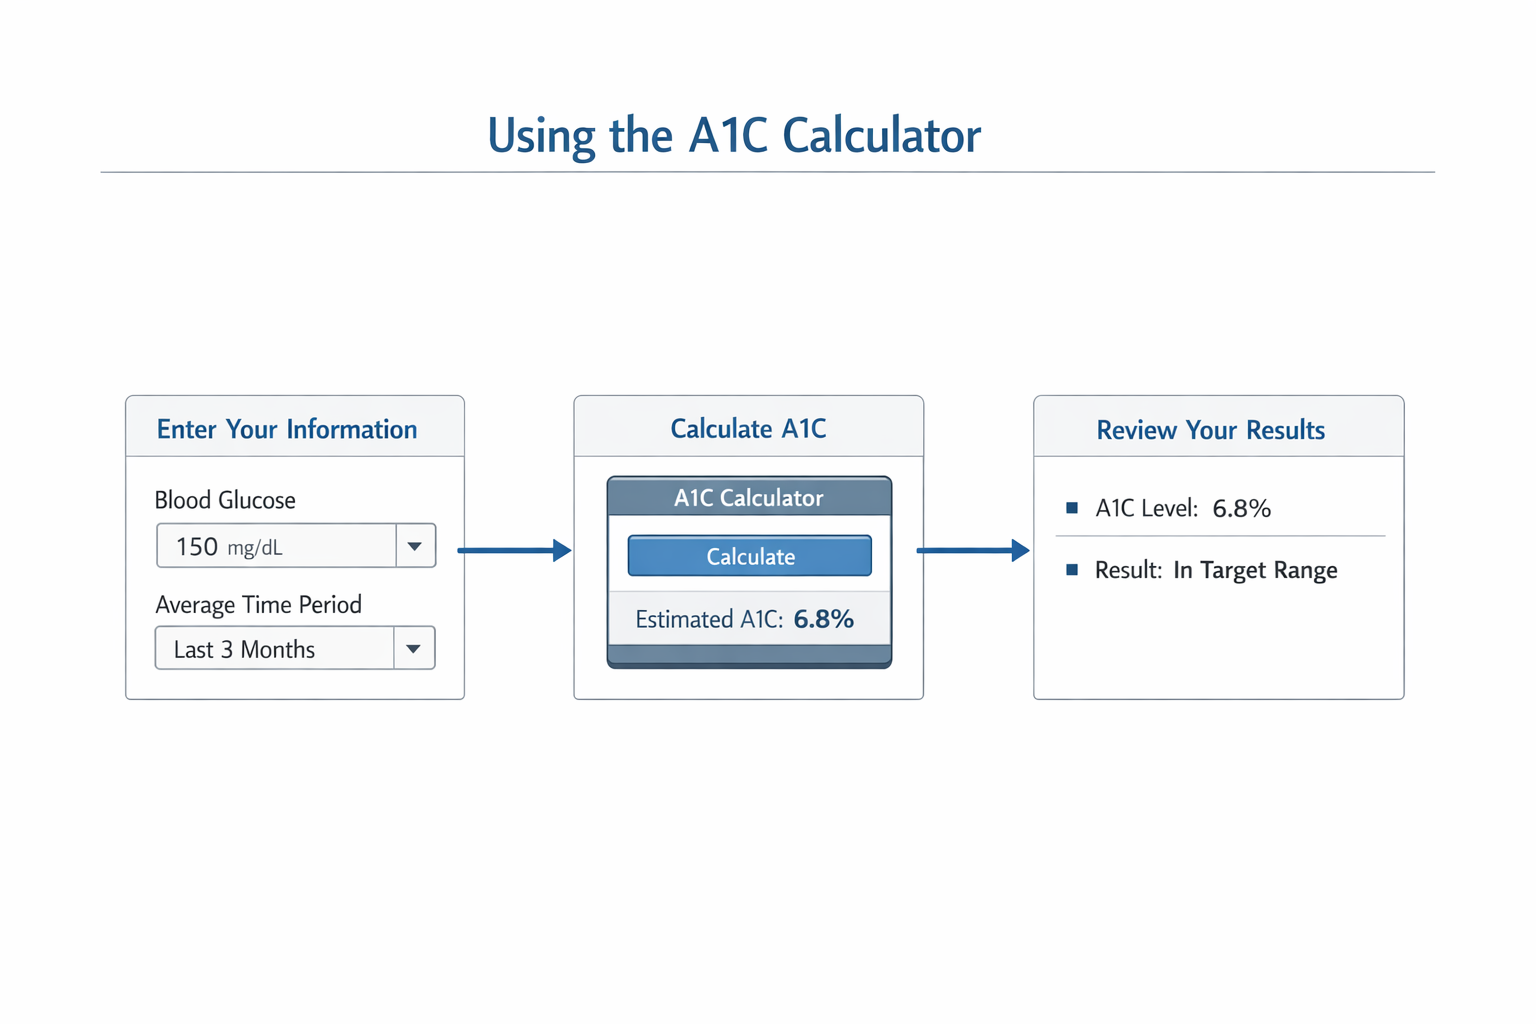
An A1C calculator converts your A1C percentage into an estimated average glucose (eAG) value, helping you see what your A1C means in the same units your meter displays daily. The calculator uses a standard formula derived from clinical research, translating the three-month average reflected in your A1C into a number that mirrors your day-to-day glucose readings.
To use the calculator, enter your most recent A1C percentage. The tool returns an eAG in mg/dL (or mmol/L, depending on the calculator's settings). For example, an A1C of 7% corresponds to an eAG of approximately 154 mg/dL. This conversion gives you a clearer sense of where your glucose has been trending over the past two to three months.
What the Results Tell You
The eAG output from the calculator represents an average. It does not show glucose variability — the highs and lows that occur throughout the day. Two people with the same A1C can have very different daily glucose patterns. One might have stable readings close to the average, while another experiences frequent swings above and below target.
If you use a continuous glucose monitor (CGM), you may see a related metric called the glucose management indicator (GMI). GMI is calculated from your CGM data over the past 14 days and estimates what your lab A1C might be. Comparing GMI to your lab A1C can reveal whether short-term glucose control aligns with the longer three-month picture. For more on how average blood sugar relates to A1C, see Average Blood Sugar by A1C: Conversion Explained for Better Management.
Understanding the Limitations
The calculator provides a useful snapshot, but it is not a diagnostic tool. Factors like red blood cell turnover, anemia, certain medications, and hemoglobin variants can affect A1C accuracy. The calculator assumes a standard relationship between A1C and glucose, which holds true for most people but not all.
Target ranges also vary by individual. The American Diabetes Association (ADA) suggests an A1C below 7% for many adults with diabetes, but your care team may set a different goal based on your age, health conditions, risk of hypoglycemia, and treatment plan. Always confirm your personal target with your provider rather than relying solely on population-based benchmarks.
Next Steps Based on Your Results
If your calculator result shows an eAG above your target, discuss the number with your care team at your next appointment. They may recommend adjustments to medication, meal planning, or physical activity. If your eAG is within range, the calculator confirms that your current approach is working, though continued monitoring remains essential.
The calculator is a translation tool, not a prescription. It turns a percentage into a number you recognize from daily testing, making the A1C result more tangible. Use it to prepare questions for your care team and to track progress over time, but always route treatment decisions through your provider.
A1C Conversion and Charts
Converting A1C to estimated average glucose (eAG) gives you a clearer picture of what your A1C percentage means in the daily glucose readings you see on a meter or continuous glucose monitor. The conversion is straightforward: multiply your A1C percentage by 28.7, then subtract 46.7 to get your eAG in mg/dL. For example, an A1C of 7% translates to an eAG of about 154 mg/dL.
This conversion helps bridge the gap between a lab test that reflects two to three months of glucose exposure and the moment-to-moment readings you track at home. When you see your A1C result, the eAG gives you a reference point for what your average glucose level has been over that period.
How A1C Relates to Daily Glucose Patterns
A1C reflects average glucose, but it doesn't show the full story of daily variation. Two people with the same A1C can have very different glucose patterns — one might have steady readings near the target range, while another experiences frequent highs and lows that average out to the same number.
Continuous glucose monitoring systems display this variability through metrics like time in range (TIR), which shows the percentage of time glucose stays between 70–180 mg/dL. The glucose management indicator (GMI) is another short-term measure derived from CGM data over 14 days, offering a more recent snapshot than A1C. When reviewing glucose control, both GMI and the most recent A1C value provide complementary information — GMI captures recent trends, while A1C reflects longer-term exposure.
Reading A1C Conversion Charts
A1C conversion charts list A1C percentages alongside their corresponding eAG values, making it easy to see what a given A1C means in familiar glucose units. These charts typically show A1C values from 5% to 12% or higher, with eAG values in both mg/dL and mmol/L.
For instance:
- A1C 5% → eAG ~97 mg/dL
- A1C 6% → eAG ~126 mg/dL
- A1C 7% → eAG ~154 mg/dL
- A1C 8% → eAG ~183 mg/dL
- A1C 9% → eAG ~212 mg/dL
These charts are useful for understanding where you stand and what changes might be needed. If your A1C is higher than your target, the eAG shows you the average glucose level you'd need to bring down through medication adjustments, diet, or activity changes.
A1C tells you the average, but daily glucose patterns reveal the path to better control.
Practical Applications of A1C Conversion
Knowing your eAG helps you set realistic expectations for daily glucose management. If your A1C is 8% (eAG ~183 mg/dL), you know that bringing your average glucose readings closer to 154 mg/dL (A1C 7%) is the next milestone. This gives you a concrete number to aim for when reviewing your meter or CGM data.
Conversion also clarifies conversations with your care team. When your provider discusses an A1C goal, translating that to eAG helps you understand what it means for your daily routine. It's easier to picture reducing your average glucose from 183 to 154 mg/dL than to think abstractly about lowering A1C by one percentage point.
For those using CGM, the ambulatory glucose profile (AGP) displays glucose data as if all readings occurred in a single 24-hour period, showing the median line, interquartile range, and outer percentile bands. The median line indicates whether your average glucose stays within the target range, while the interquartile range reveals how much your glucose varies from day to day. A wider band suggests greater variability, which may require adjustments to medication timing or meal planning.
When to Use Conversion Tools
Use A1C conversion when you receive a new lab result and want to understand it in the context of your daily readings. If you're newly diagnosed or adjusting treatment, seeing your eAG alongside your A1C can make the number feel more actionable.
Conversion is also helpful when comparing A1C results over time. If your A1C drops from 8% to 7.5%, the eAG shows that your average glucose decreased from about 183 to 169 mg/dL — a tangible improvement you can connect to recent changes in your routine.
For more on how A1C and average glucose relate, see Average Blood Sugar by A1C: Conversion Explained for Better Management.
Remember that A1C and eAG are averages. They don't capture hypoglycemia risk or glucose variability, both of which matter for overall diabetes management. Use conversion as one tool among many, and always discuss your targets and trends with your care team to ensure your plan fits your individual needs.
Frequently asked questions
How often should you have your A1C tested?
Testing frequency depends on your diabetes type, treatment plan, and how well your blood glucose is controlled. The ADA Standards of Care recommend testing at least twice a year if you're meeting treatment goals, and quarterly (every three months) if your therapy has changed or you're not meeting targets. Your care team will set a schedule based on your individual situation — some people test more frequently during medication adjustments or pregnancy.
Can your A1C be wrong?
Yes. Several factors can affect A1C accuracy, and the test doesn't work the same way for everyone. Conditions that shorten red blood cell lifespan — such as anemia, recent blood loss, or certain hemoglobin variants — can produce falsely low A1C results. Conversely, iron deficiency or vitamin B12 deficiency may elevate A1C readings. Chronic kidney disease introduces additional variables: urea can bind to hemoglobin and interfere with some A1C measurement methods, and altered red blood cell turnover changes the glucose-exposure window the test is supposed to capture.
If your A1C doesn't match your daily glucose readings or CGM trace, bring that discrepancy to your next appointment. Your care team may order a different test or use alternative markers.
Does alcohol affect your A1C?
Research shows that regular alcohol consumption is associated with lower A1C values, independent of actual glucose control. This doesn't mean alcohol improves diabetes management — it means the A1C number may underestimate your true average glucose if you drink regularly. The mechanism isn't fully understood, but the effect has been documented in large cohort studies. If you consume alcohol frequently, mention it when reviewing A1C results with your care team; they may place more weight on your daily glucose logs or CGM data.
Why is your A1C higher than your meter suggests?
A1C reflects a weighted average of glucose over roughly three months, with recent weeks contributing more than earlier weeks. If you've been checking your glucose at specific times — fasting in the morning, or two hours after meals — you're sampling a narrow window. A1C captures overnight glucose, post-meal peaks you didn't test, and the hours between checks. A continuous glucose monitor (CGM) often reveals patterns that fingerstick testing misses, and those patterns drive A1C up or down.
Another possibility: your meter and the lab use different calibration standards, or your A1C is affected by one of the biological factors described above. Compare your meter's average to the lab's estimated average glucose (eAG) — if they're far apart, investigate further.
Is an A1C of 5.7% the same as prediabetes?
The ADA defines prediabetes as an A1C between 5.7% and 6.4%. However, A1C alone identifies fewer people at risk than fasting plasma glucose or an oral glucose tolerance test. Studies show that fasting glucose can identify twice as many individuals who will progress to type 2 diabetes as A1C in this range. A1C below 6.0% has limited diagnostic utility for prediabetes, which is why some clinicians prefer glucose-based testing for screening.
If your A1C falls in the prediabetes range, your care team may confirm with additional tests and discuss lifestyle or medication interventions. The diagnostic label matters less than the conversation it starts about prevention.
Can you lower your A1C in one month?
A1C represents a roughly three-month average, but recent glucose levels — especially the past 30 days — contribute more heavily to the result. Aggressive changes to diet, activity, or medication can move A1C within four to six weeks, but the shift will be modest unless your starting glucose was very high. Expecting a full percentage-point drop in one month is unrealistic for most people; a 0.3–0.5% reduction is more typical with sustained effort.
Rapid A1C reduction isn't always the goal. If you've had elevated glucose for years, a sudden drop can temporarily worsen retinopathy or cause hypoglycemia if medications aren't adjusted. Work with your care team to set a safe pace.
What's a "normal" A1C if I don't have diabetes?
In people without diabetes, A1C typically ranges from 4.0% to 5.6%. However, "normal" varies by age, ethnicity, and other factors. A1C rises slightly with age even in the absence of diabetes, and some populations have higher baseline A1C levels independent of glucose metabolism. The ADA uses 5.7% as the lower threshold for prediabetes, but that cutoff is a population-level guideline, not a bright line for individuals.
If you're monitoring A1C for screening purposes, focus on trends over time rather than a single number. A rising A1C — even within the "normal" range — may signal early metabolic changes worth discussing with your doctor.
Should I use an A1C calculator or chart?
A1C-to-glucose conversion charts and calculators provide estimated average glucose (eAG) based on population data. They're useful for understanding what an A1C percentage means in daily glucose terms, but they don't account for individual variation. Two people with the same A1C can have different glucose patterns — one with steady levels, another with wide swings — and the eAG formula averages those out.
Use conversion tools to contextualize your A1C, but don't treat the eAG as a prescription or a target. Your care team will interpret your A1C alongside your glucose logs, symptoms, and treatment response to set goals that fit your situation.
Conclusion
Understanding your A1C number is one of the most actionable steps you can take in managing diabetes. This single measurement reflects your average blood glucose over the past two to three months, offering a clear window into how well your current treatment plan is working. When our team delves into the intricacies of A1C levels, we prioritize translating complex medical guidelines into plain language that anyone can understand—because knowing what the number means is the first step toward changing it.
The strategies we've covered—tracking patterns with a CGM, adjusting your diet to reduce glucose spikes, staying physically active, and working closely with your care team—are all supported by peer-reviewed research showing that even modest reductions in A1C can significantly lower your risk of complications. A 1 percentage point increase in HbA1c has been associated with a 20–30% increase in mortality or risk of cardiovascular events, which underscores why consistent management matters so much.
Whether you're newly diagnosed or adjusting to a new medication, the A1C test remains your most reliable checkpoint. Use the average blood sugar by A1C conversion tools and charts we've discussed to contextualize your results, but always confirm your individual targets with your healthcare provider. Our goal is to equip you with the knowledge to have informed discussions with your care team, empowering you to take actionable steps towards managing your health effectively.
If your A1C isn't where you want it to be, that's information—not a verdict. Every test is a chance to adjust, learn, and move forward. Your next appointment is the right place to start.

Maren Alcott is the lead presenter at DiabetesCompass. She is an AI-presented digital character. Every article Maren presents is researched and fact-checked by the DiabetesCompass editorial team against the ADA Standards of Care, peer-reviewed journals, and named clinical sources. Maren does not give medical advice — for questions about your specific situation, talk to your care team.