
A1C to Blood Glucose Conversion Chart & Calculator
Use our A1C to blood glucose conversion chart to translate your A1C results into average daily glucose levels and better understand your diabetes management.

On this page
Introduction to A1C and Blood Glucose
When you receive diabetes lab results, two numbers typically appear: your A1C percentage and your blood glucose readings from finger-stick or continuous monitoring. These measurements tell different stories about your glucose control, and understanding how they connect gives you a clearer picture of your diabetes management.
A1C—also called glycated hemoglobin or HbA1c—reflects the percentage of your red blood cells that have glucose attached to them. Because red blood cells live approximately three months, the A1C test captures an average of your blood glucose levels over that period. This makes it the primary long-term marker clinicians use to evaluate diabetes control and estimate the risk of complications.
Daily blood glucose measurements, whether from a meter or a continuous glucose monitor (CGM), show you what is happening right now or over the past few hours. These readings help you make immediate decisions about food, activity, and medication. For a broader understanding of how A1C percentages translate into daily glucose patterns, see our guide on average blood sugar by A1C conversion.
Why Both Metrics Matter
A1C and daily glucose readings are complementary. A1C tells you whether your overall management strategy is working over weeks and months. Daily readings tell you whether a specific meal, stress event, or medication adjustment moved your glucose up or down. Neither measurement alone gives the full picture.
For example, two people with the same A1C of 7% may have very different glucose patterns. One person may have stable readings close to target most of the day. Another may swing between frequent lows and highs that average out to the same number. The A1C cannot distinguish between these scenarios, which is why clinicians increasingly use A1C alongside time-in-range data from CGMs.
A1C remains the reference test to monitor glucose levels in patients with diabetes and estimate average blood glucose over two to three months, but it does not provide information on daily variability.
Understanding how your A1C percentage corresponds to an estimated average glucose level helps you connect your lab results to the numbers you see on your meter or CGM. The conversion is not exact—individual factors like red blood cell turnover, anemia, and certain medical conditions can affect A1C accuracy—but it provides a useful frame of reference for most people.
In the sections that follow, we present a detailed A1C to blood glucose conversion chart, explain how to interpret your levels, and discuss what different A1C ranges mean for diabetes management and health outcomes. Confirm your personal targets and any treatment adjustments with your care team, as goals vary based on your diabetes type, other health conditions, and individual circumstances.
The Conversion Chart
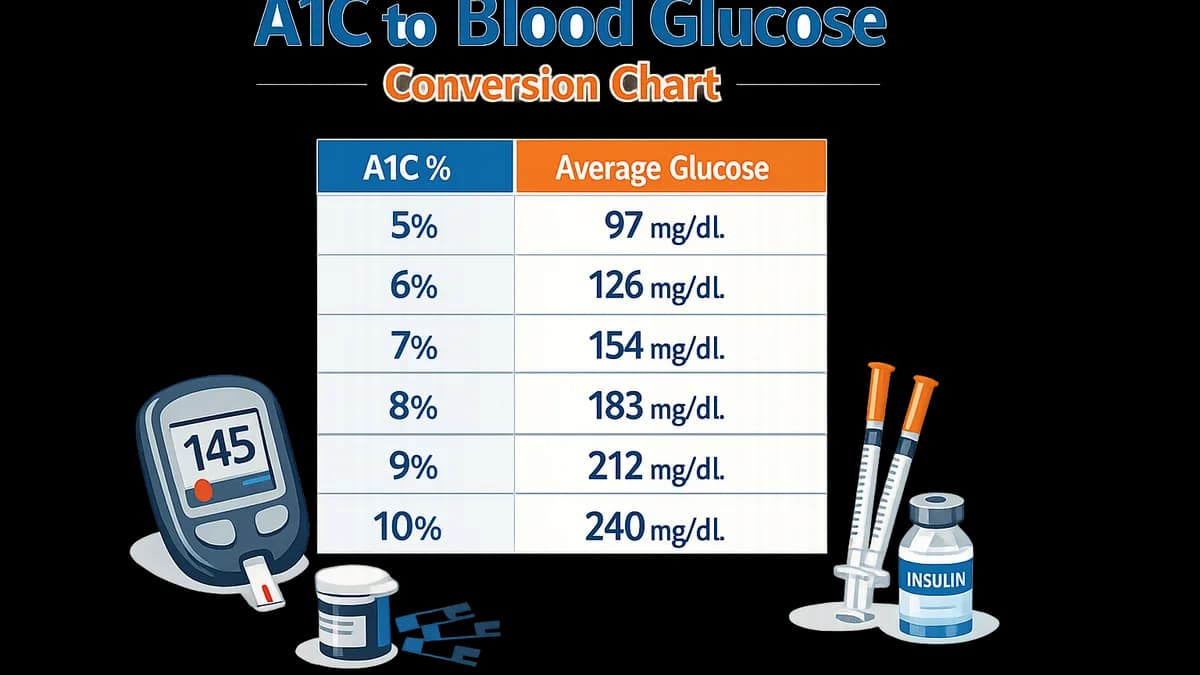
An A1C to blood glucose conversion chart translates your A1C percentage into an estimated average glucose (eAG) level — the number you'd see on a meter if you tested throughout the day and averaged all the results. This conversion helps bridge the gap between the three-month snapshot your A1C provides and the daily glucose readings you monitor at home.
Understanding the A1C to Average Glucose Relationship
A1C measures the percentage of hemoglobin in your red blood cells that has glucose attached to it. Because red blood cells live for about three months, the A1C reflects your average glucose exposure over that period. The conversion to average glucose is based on mathematical modeling from large-scale studies that compared thousands of A1C results with continuous glucose monitoring data.
The relationship is consistent across different populations, but it's important to remember that two people with the same A1C may have very different daily glucose patterns — one might have steady levels while another experiences frequent highs and lows that average out to the same number.
| A1C (%) | Estimated Average Glucose (mg/dL) | Estimated Average Glucose (mmol/L) |
|---|---|---|
| 5 | 97 | 5.4 |
| 6 | 126 | 7.0 |
| 7 | 154 | 8.6 |
| 8 | 183 | 10.2 |
| 9 | 212 | 11.8 |
| 10 | 240 | 13.4 |
| 11 | 269 | 14.9 |
| 12 | 298 | 16.5 |
How to Use the Conversion Chart
When you receive an A1C result from your lab, locate that percentage in the first column. The corresponding average glucose values show what your meter readings would average if you tested consistently throughout the day. For example, an A1C of 7% corresponds to an estimated average glucose of 154 mg/dL (8.6 mmol/L).
This conversion is most useful when you're comparing your A1C trend to your home monitoring data. If your meter readings consistently average around 180 mg/dL but your A1C corresponds to 154 mg/dL, that discrepancy might indicate you're testing more often during higher periods or that your meter needs calibration.
Reading the Chart in Context
The chart converts A1C percentages to average glucose, but it doesn't tell you about glucose variability — how much your levels swing throughout the day. Someone with an A1C of 7% might have glucose readings that stay between 120 and 180 mg/dL, while another person with the same A1C might fluctuate between 80 and 240 mg/dL. Both scenarios produce the same average, but the second pattern carries higher risk for hypoglycemia and complications.
If you use a continuous glucose monitor (CGM), you can compare your device's reported average glucose to the chart's conversion. Modern CGMs calculate a glucose management indicator (GMI), which estimates what your A1C should be based on your CGM data. Significant differences between your lab A1C and your GMI may point to testing gaps, sensor accuracy issues, or conditions that affect hemoglobin turnover.
The conversion chart translates a three-month average into daily terms, but your individual glucose pattern — the highs, lows, and stability between tests — matters just as much as the average itself.
For a deeper look at what different A1C levels mean for your health and how to interpret your results in the context of diabetes management goals, see our guide on A1C conversion and what your number means.
When to Confirm Your Numbers
Always discuss your A1C results and corresponding average glucose levels with your care team before making changes to your treatment plan. The chart provides context, but your provider interprets your A1C alongside other factors — your medication regimen, recent illness, kidney function, anemia, and other conditions that can affect A1C accuracy. They'll also set your personal A1C target, which may be higher or lower than general population benchmarks depending on your individual situation.
Implications of A1C Levels
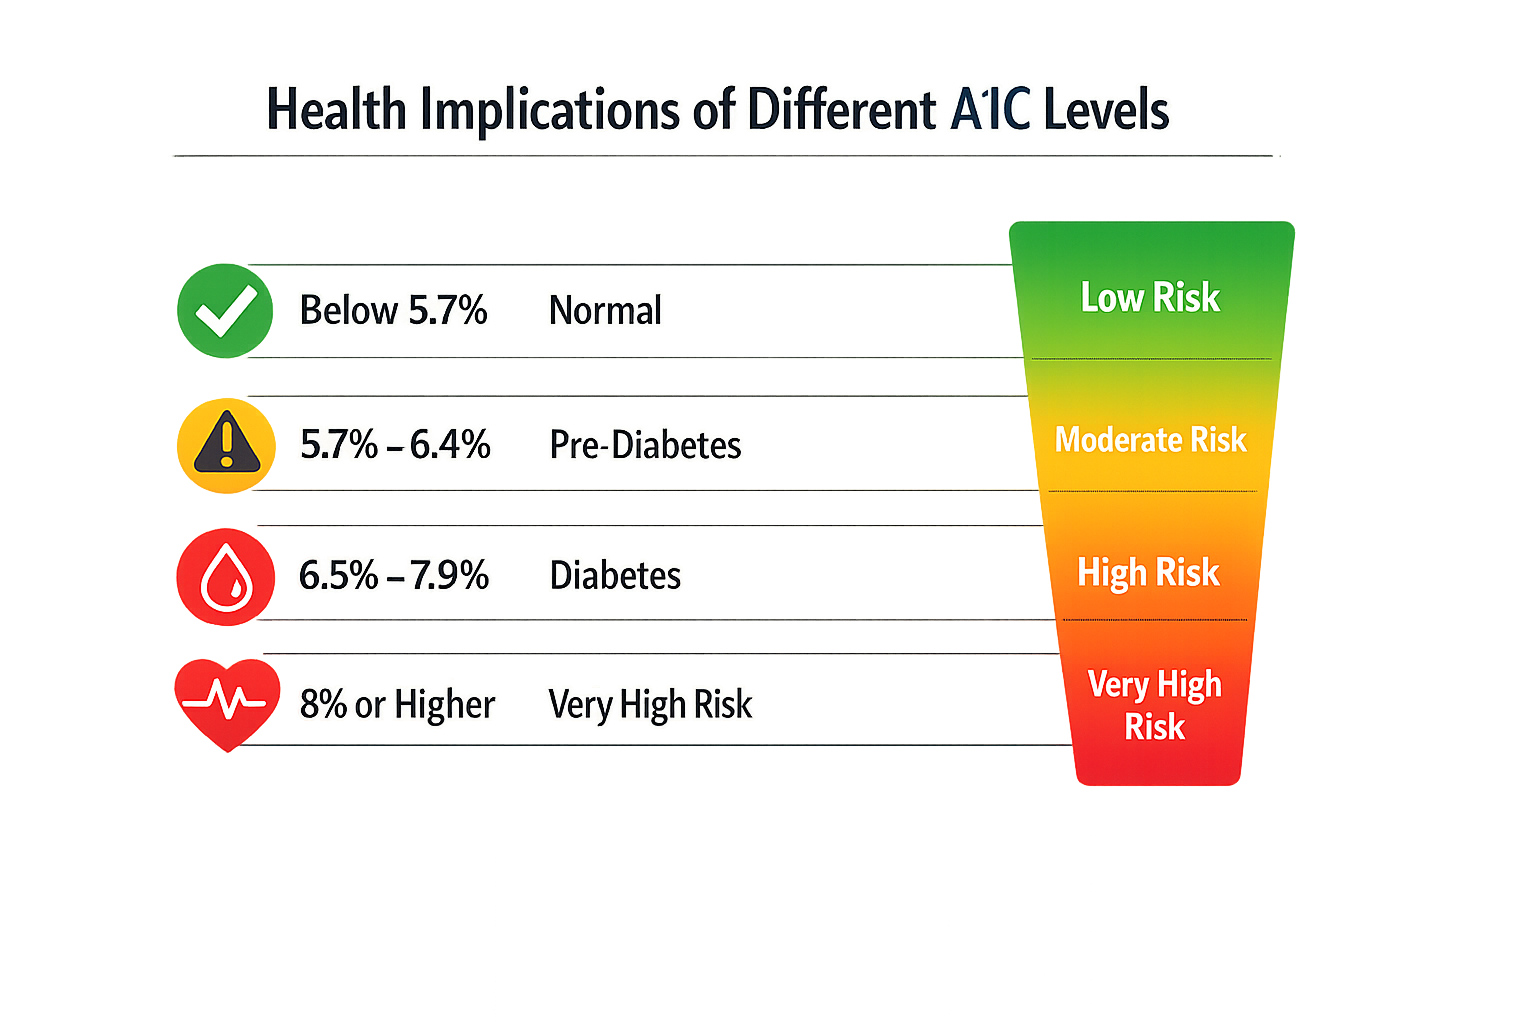
Your A1C result is more than a number on a lab report — it signals your risk trajectory and helps your care team decide next steps. Understanding what different A1C ranges mean for your health can guide conversations with your provider and clarify why certain management strategies are recommended.
What Different A1C Ranges Indicate
A1C levels below 5.7% are generally considered normal for people without diabetes. Values between 5.7% and 6.4% fall into the prediabetes range, where blood glucose is elevated but not yet high enough to meet the diagnostic threshold for type 2 diabetes. An A1C of 6.5% or higher on two separate tests typically confirms a diabetes diagnosis, though your provider will consider other factors alongside this result.
Once diagnosed with diabetes, the target A1C your provider recommends depends on your individual situation — age, other health conditions, risk of hypoglycemia, and how long you've had diabetes all factor into what's appropriate for you. The ADA Standards of Care suggest that many adults with diabetes aim for an A1C below 7%, but your personal goal may be higher or lower.
Why A1C Monitoring Matters
Regular A1C testing — typically every three to six months — allows your care team to assess whether your current treatment plan is working or needs adjustment. Trends matter as much as single results: a steady A1C suggests stable management, while rising values may prompt medication changes, referrals to diabetes education, or closer follow-up.
A1C also serves as a predictor for diabetes-related complications. Higher A1C levels over time are associated with increased risk of retinopathy, nephropathy, neuropathy, and cardiovascular disease. Lowering A1C reduces these risks, though the degree of benefit varies by individual and by how much the A1C is reduced. For more context on what your A1C number means and strategies to bring it down, see our guide on A1C conversion: what your number means and how to lower it.
Factors That Affect A1C Accuracy
While A1C is a reliable measure for most people, certain conditions can affect its accuracy. Hemoglobin variants, chronic kidney disease, recent blood transfusions, and conditions that alter red blood cell lifespan — such as hemolytic anemia or iron deficiency — can cause A1C results to be misleadingly high or low. If your A1C doesn't align with your daily glucose readings or you have one of these conditions, discuss alternative monitoring strategies with your provider.
A1C is a snapshot of average glucose over three months, but it doesn't capture daily variability, hypoglycemia frequency, or the patterns that matter for day-to-day management.
Continuous glucose monitors (CGMs) and frequent fingerstick testing provide complementary information that A1C alone cannot — they reveal glucose trends, time in range, and episodes of low blood sugar that A1C averages out. Your provider may use both A1C and CGM-derived metrics to build a fuller picture of your glucose control.
Confirm Your Targets With Your Care Team
No single A1C target fits everyone. Older adults, people with a history of severe hypoglycemia, those with limited life expectancy, or individuals with advanced complications may have less stringent A1C goals to reduce the risk of dangerous lows. Conversely, younger adults with recent-onset diabetes and no complications may aim for tighter control to prevent long-term damage.
Your care team will weigh your specific circumstances — medical history, treatment burden, personal preferences, and access to resources — when setting your A1C goal. Routine monitoring and open communication ensure that your target remains appropriate as your health and life situation evolve.
Conclusion
Understanding the relationship between A1C and blood glucose levels is a cornerstone of effective diabetes management. The A1C to blood glucose conversion chart translates your three-month average into a daily context, helping you see how your treatment plan is working over time. While A1C remains the primary marker for long-term glucose control, it doesn't capture the full picture—daily fluctuations, hypoglycemia episodes, and post-meal spikes can all fall outside what A1C reveals.
That's why pairing A1C results with tools like continuous glucose monitoring (CGM) or regular fingerstick testing gives you a more complete view. A1C tells you where you've been; daily glucose data shows you where you are right now and helps you adjust before patterns become problems. For many people, seeing both numbers side by side clarifies what lifestyle changes, medication adjustments, or timing tweaks make the most difference.
As you use the conversion chart to interpret your results, remember that your target A1C and glucose ranges are individual. What works for one person may not be the right goal for another, depending on age, duration of diabetes, risk of hypoglycemia, and other health factors. Always confirm your personal targets with your care team rather than aiming for a generic number.
For a deeper look at what different A1C values mean and evidence-based strategies to bring yours down, explore our guide on how to lower your A1C naturally. Proactive monitoring, informed conversations with your healthcare provider, and consistent small adjustments add up to meaningful progress over time.
Explore our A1C to blood glucose conversion chart to improve your diabetes management and understand your health better.

Maren Alcott is the lead presenter at DiabetesCompass. She is an AI-presented digital character. Every article Maren presents is researched and fact-checked by the DiabetesCompass editorial team against the ADA Standards of Care, peer-reviewed journals, and named clinical sources. Maren does not give medical advice — for questions about your specific situation, talk to your care team.