
Average Blood Sugar by A1C: Conversion Explained for Better Management
Learn how Average Blood Sugar by A1C levels correspond to each other. Understand A1C-to-glucose conversion for better diabetes management and monitoring.

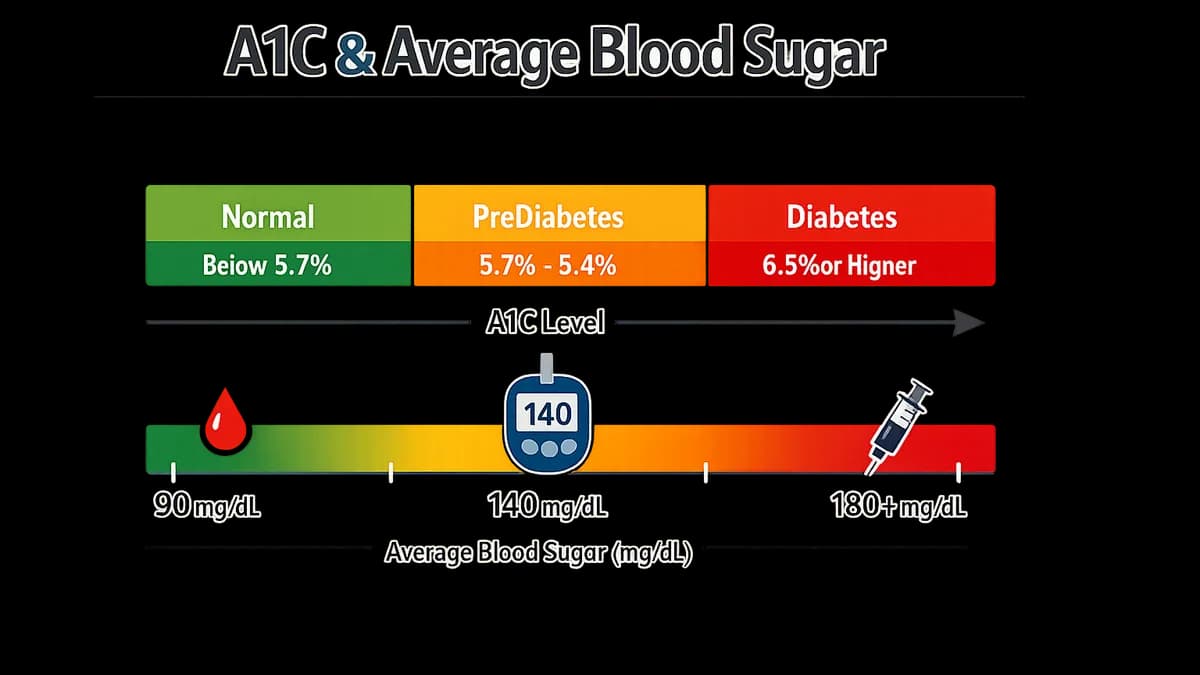
On this page
Introduction
The A1C test translates months of blood sugar control into a single percentage — but what does that percentage actually mean in terms of the glucose numbers you see on your meter every day? Our team often encounters questions about the relationship between A1C levels and average blood sugar levels. Understanding this connection is crucial for anyone managing diabetes.
Average Blood Sugar by A1C is a key concept in diabetes management. When you receive an A1C result — say, 7% or 8.5% — it reflects how much glucose has attached to the hemoglobin in your red blood cells over their roughly three-month lifespan. That percentage corresponds to a calculated average blood sugar level, measured in milligrams per deciliter (mg/dL) in the United States or millimoles per liter (mmol/L) in many other countries. Knowing how to convert between these measurements helps you connect your A1C result to the daily glucose readings you're already tracking.
This relationship matters because A1C and daily monitoring serve different purposes. Your daily readings show immediate patterns — how a meal affects your glucose, whether your morning levels are stable, or if you're experiencing lows overnight. A1C smooths out those day-to-day variations into a long-term average, which is why diabetes care teams use it to assess overall control and adjust treatment plans. Neither measurement tells the whole story alone; together, they guide safer, more effective management.
The conversion between A1C and average blood sugar isn't perfectly precise for every individual — factors like red blood cell turnover, anemia, and glucose variability can affect the correlation — but the standard formulas provide a reliable general framework. For context on how daily monitoring fits into the bigger picture, see our guide on prescription requirements for CGM in 2026.
In the sections that follow, we'll break down what A1C measures, show you the standard conversion formulas, and explain how to use both A1C and daily glucose data to make informed decisions with your care team. These numbers should always be interpreted in consultation with your healthcare provider, who can tailor targets and treatment to your specific health needs and circumstances.
Understanding A1C and Blood Sugar Levels
A1C—also written as HbA1c or glycated hemoglobin—is a blood test that reflects your average blood glucose level over the past two to three months. When glucose circulates in your bloodstream, some of it binds to hemoglobin, the oxygen-carrying protein inside red blood cells. Because red blood cells live for about three months, the A1C test captures a snapshot of how much glucose has been attaching to hemoglobin during that period.
Why A1C Matters for Diabetes Management
A1C is the primary measure clinicians use to assess long-term glucose control and to estimate the risk of diabetes-related complications. Unlike a single fingerstick or CGM reading—which shows your glucose at one moment—A1C smooths out the peaks and valleys to give a broader picture. It's a key marker for microvascular complications (kidney, nerve, and eye damage) and cardiovascular events.
That said, A1C doesn't tell you everything. It won't show you daily glucose swings, overnight lows, or post-meal spikes. For a complete view, many care teams now combine A1C results with continuous glucose monitoring data or regular fingerstick logs.
How A1C Relates to Average Blood Sugar
The A1C percentage corresponds to an estimated average glucose level, typically reported in mg/dL in the United States. For example, an A1C of 7% roughly translates to an average blood glucose of about 154 mg/dL over the measurement period. The next section will detail the conversion formulas and provide a reference table, but the core concept is straightforward: higher A1C means higher average glucose, and vice versa.
A1C remains the reference test to monitor glucose levels and estimate the average blood glucose over two to three months.
Remember that individual factors—such as anemia, certain hemoglobin variants, pregnancy, or kidney disease—can affect A1C accuracy. If your A1C result doesn't match your daily glucose readings, discuss it with your care team. They may recommend additional tests or adjust how they interpret your A1C in the context of your overall health.
Conversion Between A1C and Average Blood Sugar
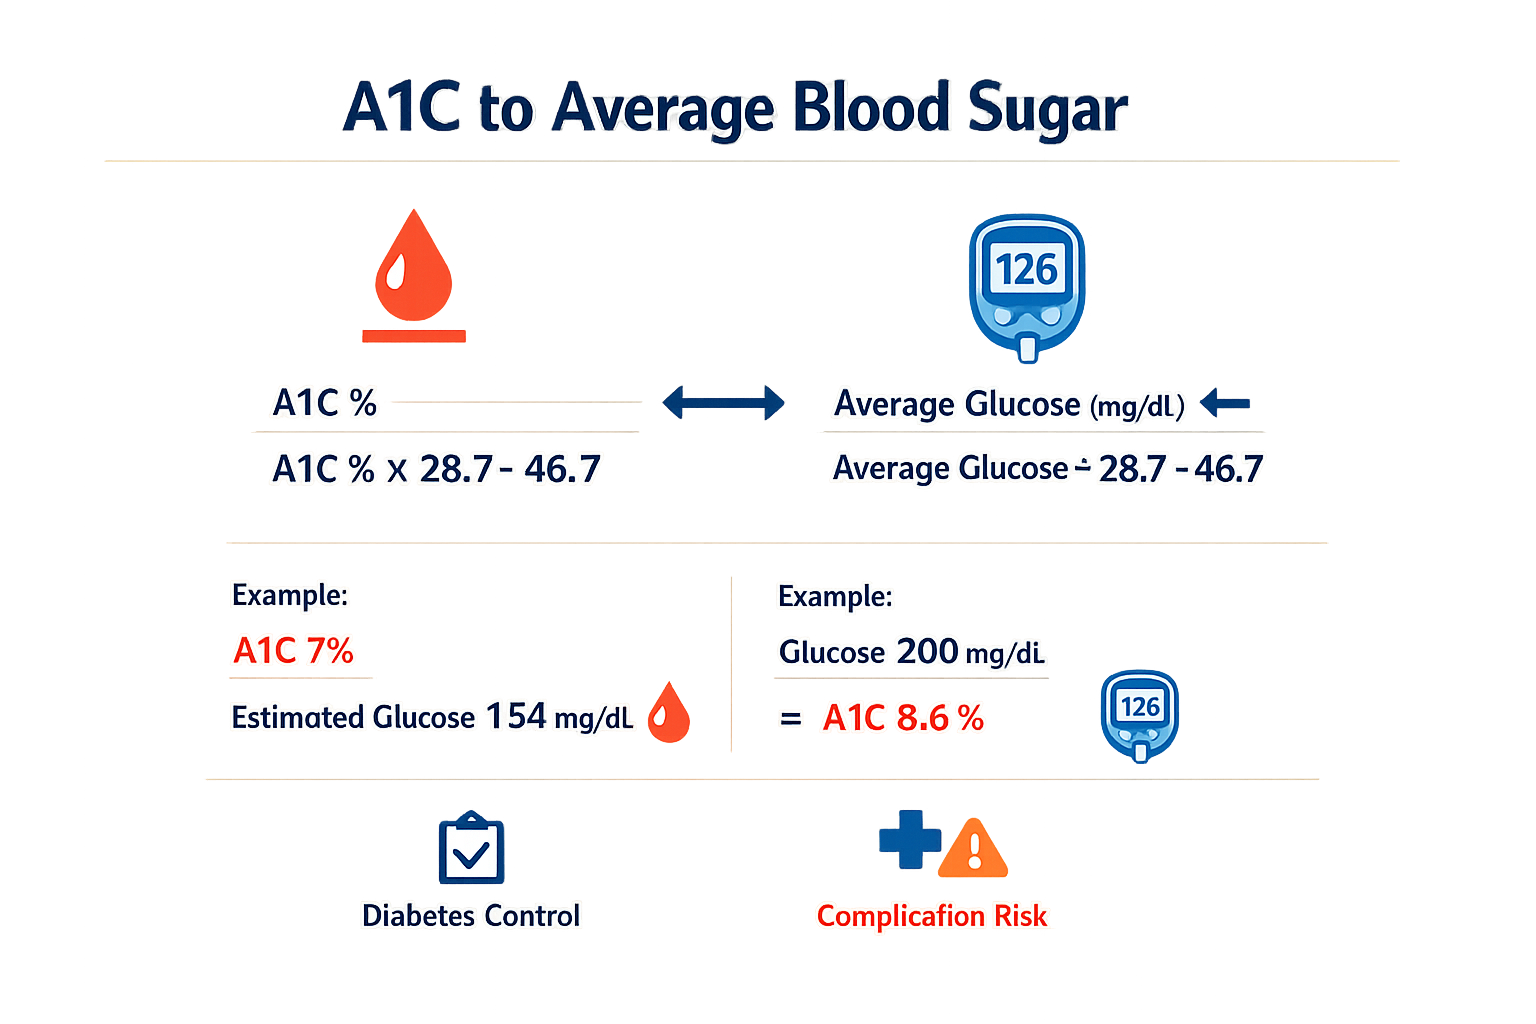
The relationship between A1C and average blood sugar follows a mathematical correlation that allows healthcare teams to estimate one value from the other. Research has demonstrated a good positive correlation between A1C concentrations and glucose levels in people with diabetes, though the exact relationship can vary between individuals.
The Standard Conversion Formula
The most widely used formula to estimate average blood glucose from A1C is:
Estimated Average Glucose (eAG) in mg/dL = (28.7 × A1C) – 46.7
This formula provides a general approximation based on population studies. For example, an A1C of 7% corresponds to an estimated average glucose of approximately 154 mg/dL using this calculation. An A1C of 8% translates to roughly 183 mg/dL, while an A1C of 6% suggests an average around 126 mg/dL.
Understanding Glucose Management Indicator (GMI)
For people using continuous glucose monitoring (CGM) systems, a related metric called the Glucose Management Indicator (GMI) offers another way to understand the A1C-to-glucose relationship. GMI measures short-term glucose exposure over a 14-day period and can be compared with laboratory A1C values to assess how well the sensor data reflects longer-term glucose control.
GMI and A1C don't always match perfectly. Factors like red blood cell turnover, certain medications, and individual metabolic differences can create discrepancies between what the CGM calculates and what the lab measures. When these numbers diverge, your care team will interpret both values in the context of your overall glucose patterns.
Clinical Correlation and Individual Variation
Studies have found correlation coefficients between A1C and mean glucose in the range of 0.78, indicating a strong but not perfect relationship. This means that while A1C generally tracks with average glucose levels, there's meaningful individual variation that can't be captured by a single conversion formula.
The variable relationship between A1C and estimated average glucose remains a potential source of concern when using conversion formulas for individual treatment decisions.
Several factors can affect how accurately A1C reflects average glucose:
- Red blood cell lifespan: Conditions that shorten or lengthen red blood cell survival can artificially lower or raise A1C independent of actual glucose levels
- Glucose variability: Two people with the same average glucose but different levels of daily fluctuation may have different A1C values
- Kidney function: Renal impairment can interfere with A1C measurement in some testing methods
- Certain medications: Aspirin and other compounds can bind to hemoglobin and affect some A1C assays
Time in Range as a Complementary Metric
Beyond simple averages, newer metrics like Time in Range (TIR) provide additional context for understanding glucose control. TIR measures the percentage of time glucose readings fall within a target range of 70–180 mg/dL. Recent studies have shown that TIR is inversely correlated with the prevalence of diabetes complications, including retinopathy and cardiovascular disease.
While A1C gives you a three-month average, TIR shows you the distribution of your glucose readings throughout each day. Two people might have the same A1C but very different TIR percentages if one experiences frequent highs and lows while the other maintains steadier levels. For more on how continuous monitoring works, see our guide on prescription requirements for CGM in 2026.
Using Conversion Data in Practice
Conversion formulas serve as general reference points rather than precise diagnostic tools. When your care team reviews your A1C result, they're looking at it alongside:
- Your daily glucose meter or CGM readings
- The pattern and frequency of highs and lows
- Your time in range and time below range
- Any symptoms you've reported
- Other lab values and health factors
This comprehensive view helps them understand whether your A1C accurately reflects your glucose control or whether individual factors might be influencing the number. Always confirm your personal glucose targets and A1C goals with your healthcare provider, as these vary based on your diabetes type, treatment plan, age, and other health considerations.
Managing Blood Sugar Levels
Managing blood sugar levels effectively requires a combination of monitoring, lifestyle adjustments, and coordination with your care team. While A1C provides a three-month average, daily management depends on understanding how your glucose responds to food, activity, and medication. The strategies below offer practical starting points, but your specific targets and approaches should always be confirmed with your healthcare provider.
Monitoring Techniques: Beyond the A1C Test
A1C testing shows the big picture, but day-to-day management benefits from more frequent glucose checks. Self-monitoring of blood glucose (SMBG) using a fingerstick meter provides snapshots at specific times — fasting, before meals, or two hours after eating. Continuous glucose monitoring (CGM) takes this further by tracking glucose levels throughout the day and night, revealing patterns that a few daily fingersticks might miss.
CGM devices generate an ambulatory glucose profile (AGP), which traces your median glucose reading over a 14-day period. The AGP shows whether your average glucose stays within the target range and how much it fluctuates throughout the day. If you're using CGM, review the AGP report with your care team to identify times when glucose runs high or low, and adjust your routine accordingly. For those managing diabetes with prescription CGM devices, understanding how to interpret these reports is an essential skill.
Diet and Meal Timing
What you eat and when you eat it directly affect your blood sugar levels. Carbohydrates have the most immediate impact, breaking down into glucose and entering the bloodstream. Balancing carbohydrate intake across meals — rather than concentrating it all at once — can help smooth out glucose spikes.
The American Diabetes Association (ADA) recommends specific blood glucose targets for context: fasting blood glucose below 5.3 mmol/L (approximately 95 mg/dL), one-hour postprandial (after-meal) glucose below 7.8 mmol/L (about 140 mg/dL), and two-hour postprandial glucose below 6.7 mmol/L (around 120 mg/dL). These are general benchmarks; your care team may set different targets based on your individual health profile, medication regimen, and risk of hypoglycemia.
Target glucose values provide a framework, but individual goals must account for each person's unique circumstances and risk factors.
Practical meal-planning tips include:
- Pair carbohydrates with protein and healthy fats to slow glucose absorption and reduce post-meal spikes.
- Choose whole grains, legumes, and vegetables over refined carbohydrates and sugary foods.
- Monitor portion sizes — even healthy carbohydrates raise blood sugar when eaten in large amounts.
- Track your responses — use SMBG or CGM to see how specific foods affect your glucose, then adjust portions or choices accordingly.
If you're exploring sugar substitute options, remember that not all sweeteners behave the same way; some have minimal impact on glucose, while others can cause measurable rises.
Physical Activity and Glucose Control
Exercise improves insulin sensitivity, meaning your cells use glucose more effectively during and after activity. Both aerobic exercise (walking, cycling, swimming) and resistance training (weights, bodyweight exercises) contribute to better glucose control. The timing and intensity of exercise influence how much your blood sugar drops, so it's important to monitor before, during, and after activity — especially if you take insulin or medications that increase hypoglycemia risk.
Start with moderate activity — 30 minutes most days of the week is a common guideline — and build up gradually. If you're new to exercise or have other health conditions, discuss your plan with your care team to ensure it's safe and appropriate for your situation.
Recognizing and Addressing Hypoglycemia
When managing blood sugar, avoiding lows is just as important as controlling highs. Hypoglycemia (blood glucose below 70 mg/dL, or 3.9 mmol/L) is a major limiting factor in diabetes management and a key concern for anyone taking insulin or certain oral medications. CGM data can help identify hypoglycemia risk: if 4% or more of your sensor glucose readings fall below 70 mg/dL, that signals a pattern that needs attention.
Symptoms of hypoglycemia include shakiness, sweating, confusion, rapid heartbeat, and dizziness. If you experience these, check your glucose immediately if possible, and treat with 15 grams of fast-acting carbohydrate (such as glucose tablets or half a cup of juice). Recheck after 15 minutes and repeat if needed. Discuss any recurring lows with your care team — medication doses, meal timing, or activity levels may need adjustment.
Coordinating with Your Care Team
No single monitoring tool or lifestyle change works in isolation. A1C, daily glucose checks, CGM traces, dietary patterns, and exercise routines all contribute pieces of the overall picture. Your healthcare provider integrates these data points to guide medication adjustments, set individualized targets, and help you refine your approach over time. Bring your glucose logs, CGM reports, or meter downloads to appointments, and be ready to discuss what's working and what isn't.
Conclusion and Next Steps
Understanding the relationship between Average Blood Sugar by A1C levels gives you a broader view of your glucose management over time. The A1C test reflects an average of your blood sugar over the past two to three months, translating those daily numbers into a single percentage that helps you and your care team assess long-term control. However, A1C has limitations — it doesn't capture daily fluctuations, hypoglycemic episodes, or the variability that continuous glucose monitoring reveals.
Our editors have thoroughly reviewed the ADA's Standards of Care and peer-reviewed research to ensure that the explanations here are accurate and helpful. We emphasize that while A1C levels can give a general indication of blood sugar control, individual targets and interpretations should always be confirmed with your healthcare provider. This approach helps ensure that the information is tailored to your specific health needs and circumstances.
Your next steps should include scheduling a conversation with your care team to review your current A1C result, discuss what it means in the context of your daily glucose readings, and confirm your personalized target range. If you're newly diagnosed or adjusting your management plan, ask about the timing of your next A1C test and whether additional monitoring tools — such as a continuous glucose monitor — might help you identify patterns that the A1C alone doesn't show.
For practical strategies on managing daily glucose levels, explore our guide on sugar substitute options and which sweeteners spike blood glucose to make informed choices that support your overall control. Remember, the numbers are tools for conversation, not verdicts — work with your provider to build a plan that fits your life and your goals.

Maren Alcott is the lead presenter at DiabetesCompass. She is an AI-presented digital character. Every article Maren presents is researched and fact-checked by the DiabetesCompass editorial team against the ADA Standards of Care, peer-reviewed journals, and named clinical sources. Maren does not give medical advice — for questions about your specific situation, talk to your care team.